http://seekingalpha.com/article/180548-2010-economic-trends-paths-of-least-resistance?source=article_sb_picks
I have been reading economic and financial forecasts by many. I am sure you can easily find one who agrees with your outlook – and just as many who have the opposite vision.
Based on economic fundamentals, the trends should be:
- Higher interest rates which will suppress economic activity;
- Higher taxes which will suppress economic activity;
- The evaporation of the stimulus during 2010 which will suppress economic activity;
- As the equities market is anticipating a strong “V”, there should be a correction to the downside;
- Deflation in the face of a weakening economy which should begin revealing in the second half of 2010;
- Weakening of the dollar. Whether this would strengthen or weaken the American economy depends on what happens to the world's economy;
- If world demand remains constant and the dollar weakens, then commodity prices will rise; and
- As no economic driver has yet come forward, the percentage of Americans without jobs will continue to increase throughout the year.
The art in forecasting is timing and intuition of the unknown. Every year forecasters talk about the weakening dollar, yet in 2008 they were wrong and 2009 they were right. The economy cannot be calculated like a physics equation where you simply add the forces. Therefore simply looking at fundamentals gives the wrong answer.
Economists have not learned how to control the economy – and therefore too many economic events are not foreseeable. It only takes one unforeseen economic event to make your forecast wrong.
But instead of focusing on timing and fundamentals, my 2010 forecasts focus on paths of least resistance.
Corporate Profits – Most businesses are adjusting to the New Normal. This is a costly rationalizing process which requires write-downs and some new investment. For the most part, business can be as profitable as a percentage of revenue in the New Normal as in the pre-New Normal. As 2010 progresses, profitability will continue to grow. If this is the case, the market is not overbought even if there is no economic expansion.
Government intervention – 2010 is an election year for the House of Representatives and a third of the Senate. Getting re-elected is big business. Once Congress gets this health care pork package behind them, they will dream up some misguided plan to create jobs padding the pockets of political contributors. But it will not end there. Congress need a lot of money for campaigning because they have been bad boys and girls going against the wishes of their electorate. They might even dream up some give away programs to cobble together a coalition of people who might vote for them. In many countries, the politicians are more open about buying votes.
Unemployment – The political hacks don't like double digit inflation rates. In some manner or form, the headline unemployment rate will utilize enough smoke and mirrors to be under 9% by election day. This will be easier than you think because someone unemployed for a couple of years obviously is not actively seeking employment.
Consumer Confidence – The sheep are scared. Scared sheep will over-react to events. This is the explosive material in my vision of 2010. The sheep are so skittish right now the markets will over-correct in a flash to an unforeseen event.
Federal Reserve – The Fed will be discontinuing its balance sheet expanding programs in early 2010. The two biggies are treasury purchases and securitized mortgages. Long treasuries are already drifting up. Home loans interest rates have not risen yet as the Fed is still in the market. Common wisdom is treasuries will rise because the government must sell a record $2.6 trillion of debt paper in 2010 – that is 20% of GDP. Mortgage rates should follow this rise. Do you believe the Fed will stand by while the interest rates kill the economy?
My forecast is that the government and the Fed are not going to stand idly by while Treasuries yields rise, the dollar falls into the crapper, and the economy sinks in quicksand.
This is door number three.
They don't know how to solve the real economic problems so they will simply shift the day of reckoning into the future.
I would have less of a problem with this if there was ANYTHING the government was doing to strengthen our economy in the future.
Happy New Year.
Housing
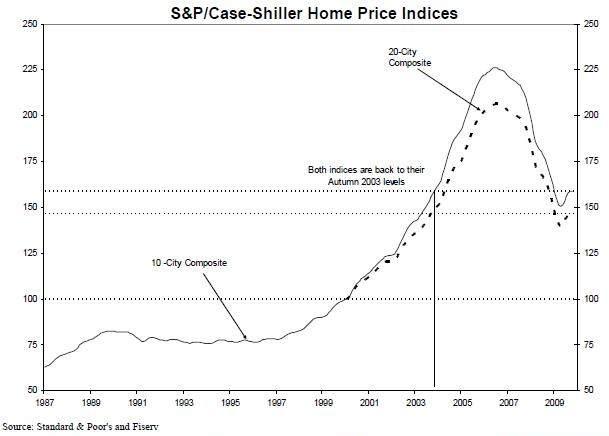
The results of the S&P / Case-Shiller Home Price Index for October 2009showed a small improvement in home prices. Per David M. Blitzer, Chairman of the Index Committee at Standard & Poor’s:
The turn-around in home prices seen in the Spring and Summer has faded with only seven of the 20 cities seeing month-to-month gains, although all 20 continue to show improvements on a year-over-year basis. All in all, this report should be described as flat. Coming after a series of solid gains, these data are likely to spark worries that home prices are about to take a second dip. Before jumping to conclusions, recognize that the one time that happened at the beginning of the 1980s, Fed policy saw dramatic reversals, which is very different from the stable and consistent Fed policy we have today. Further, sales of existing homes – those included in the S&P/Case-Shiller Home Price Indices – have been very strong in recent months, working off the inventories of houses for sale. At the same time, housing starts remain weak, fears that the market will be swamped by a wave of foreclosures are heard and government programs aimed at the housing market will expire in the first half of 2010.
Home prices are now back to the price levels of Autumn 2003.
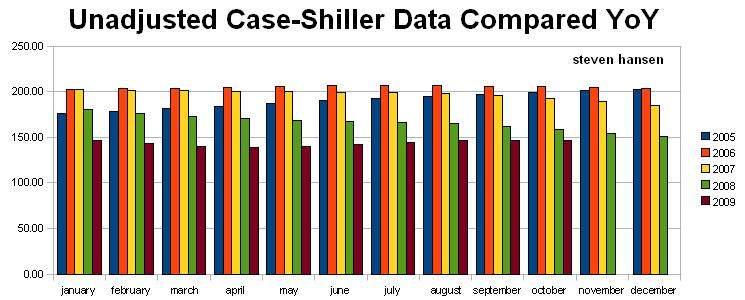
As the Case-Shiller data is unadjusted, a better way of viewing the data is YoY.
In comparing this data to the recent National Association of Realtor's (NAR) home sales data, I have used three month rolling averages of the NAR data. The Case-Shiller data is presented as three month rolling averages;
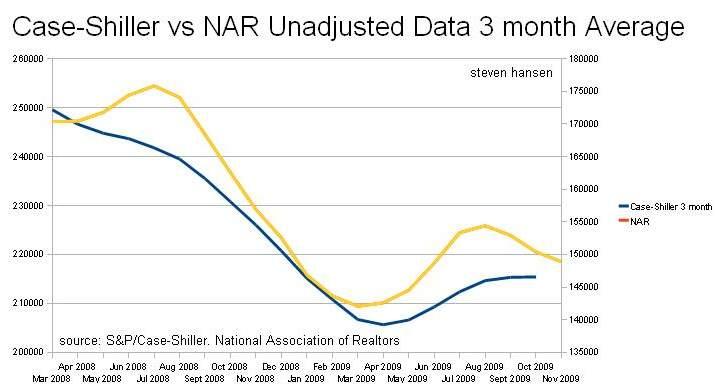
The curves do not match exactly. Both use different methodologies. The NAR data is likely to be more representative if you are not living in the 20 cities covered by the Case-Shiller data.
I thought the defensive tone of the S&P / Case-Shiller release was unusual. My take is that the October data is actually negative but as this index is a three month rolling average the arithmetic result was positive.
So be prepared for a decline in values for the November 2009 Case-Schiller data. Roubini Global Economics position of housing price stabilization remains per this September statement:
The recent signs of stabilization in housing market reflect extensive government support to the housing sector, in the form of a US$8,000 first time home buyer tax credit and low mortgage rates as a result of the Fed's purchases of mortgage backed securities (MBS). The underlying fundamentals are still too weak to drive a recovery, both on the demand side, due to the rising unemployment rate and weak personal finances of U.S. consumers and on the supply side, due to high inventories and continuing foreclosures. As government incentives are phased out, home prices are likely further to correct downwards. Regional forecasts indicate some cities such as Boston and Denver will see a gradual improvement in prices, though on a national basis, prices could fall an additional 7%.
The weekly Mortgage Bankers Association mortgage application data for the week ending 18 December 2009 fell to its lowest level this year for new mortgage applications – and has declined approximately 30% since the beginning of October. The 30 year fixed mortgage rate is unchanged at 4.92%.
Manufacturing
The Chicago Fed Midwest Manufacturing Index (CFMMI) increased 1.2% in November, to a seasonally adjusted level of 84.2 (2002 = 100). Revised data show the index rose 0.8% in October to 83.2. The Federal Reserve Board’s industrial production index for manufacturing (IPMFG) was up by 1.1% in November. Regional output in November declined 10.0% from a year earlier, and national output decreased 4.4%.
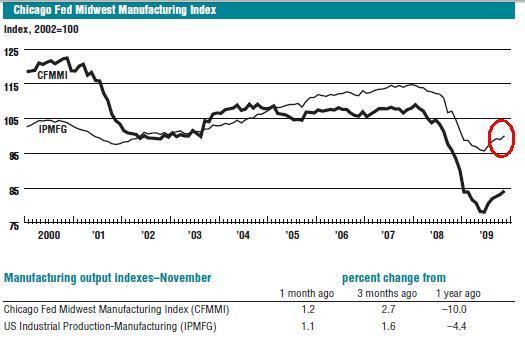
Both the Midwest and the national manufacturing data are showing improvement. 60% of both of these indexes are based on hours worked. This index correlates with other economic data.
The Chicago branch of the Institute of Supply Management released theirDecember 2009 (pdf) report saying things are better for the third straight month. [note: 24 hours after release, the Chicago ISM said their seasonal factors were wrong and were adjusted down. As I do not use seasonal factors in my analysis, this section remained as originally written.]
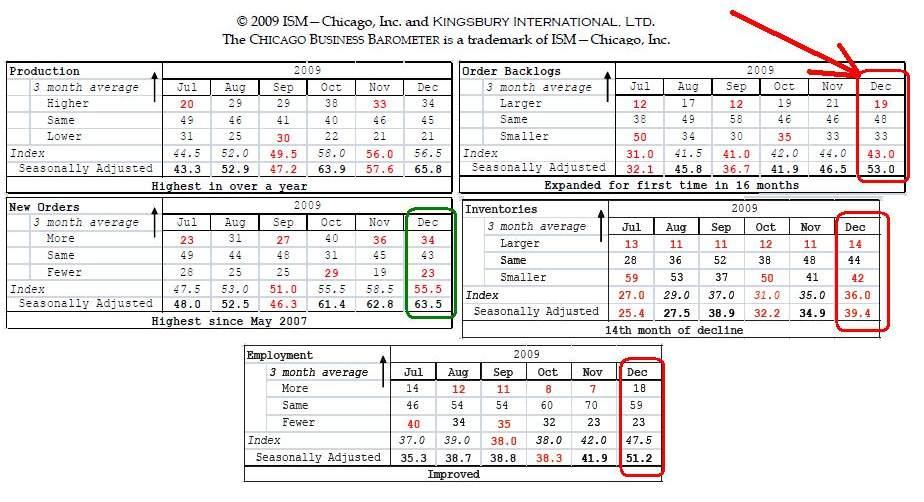
My take is you need a microscope to see that things were any better. The reality is that order backlog, employment and inventories are still dropping – meaning the rationalization process matching capacity to the New Normal is not over. New orders have a positive bias – meaning things are not as bad but that is comparative to the deep hole of the New Normal.
A provoking article in National Affairs contained the following graphic - Hat toRick Ackerman who brought this article to my attention.
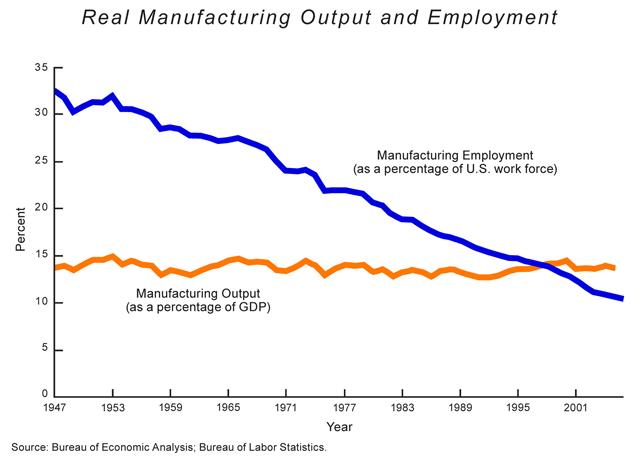
Your take from this graph should be that American can produce with less and less people.
If only this was true.
More and more of our high man-hour components in industrial production are being produced overseas. I am working this subject without nets as there is no statistical data I can produce. Our data gathering systems are not geared for this kind of analysis.
Our production output ratio to GDP remains constant. But we are contributing less and less of the man-hours required for our industrial unit output as the more and more components are made offshore. Economists call this productivity gains. What I call it outsourcing production man-hours to other nations.
Consumer Confidence (or lack thereof)
2009 will end with consumer confidence near all time highs for this year.
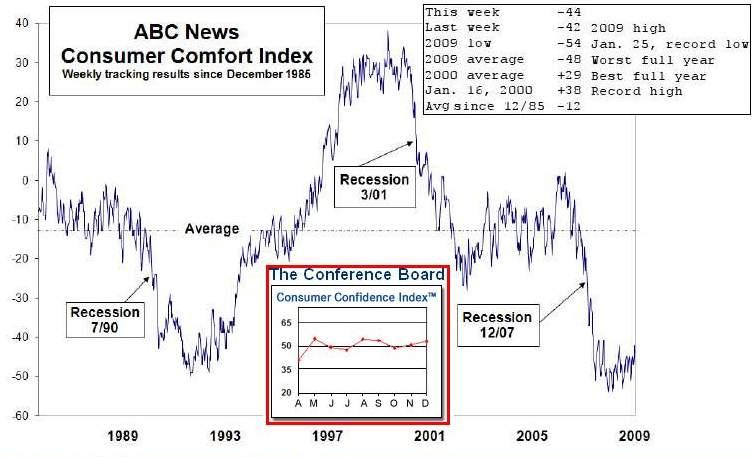
Says Lynn Franco, Director of The Conference Board Consumer Research Center concerning December 2009 consumer confidence:
Consumer Confidence posted yet another moderate gain in December as expectations for the short-term future increased to the highest level in two years (Index 75.8, Dec. 2007). The Present Situation Index, however, continued to lose ground and remains at a 26-year low (Index 17.5, Feb. 1983). A more optimistic outlook for business and labor market conditions was the driving force behind the increase in the Expectations Index. Regarding income, however, consumers remain rather pessimistic about their short-term prospects and this will likely continue to play a key role in spending decisions in early 2010.
Consumer confidence plowed through its worst year in 24 years of weekly polls, weighted down by abysmal ratings of the national economy. This week’s ABC News Consumer Comfort Index stands at -44 on its scale of +100 to -100, halting three weeks of positive momentum when it matched its yearly high last week at -42.
Both ABC and The Conference Board are saying the same thing. The difference is in the reporting periods – ABC is every two weeks while The Conference Board is monthly. Their data is fairly consistent with each other.
No matter how consumer confidence is spun – it remains near historical lows.
Jobs
Initial unemployment claims for the week ending 26 December 2009 continues its slow decline. I would not take seriously this holiday season data which can be distorted by seasonal factors and poor reporting.
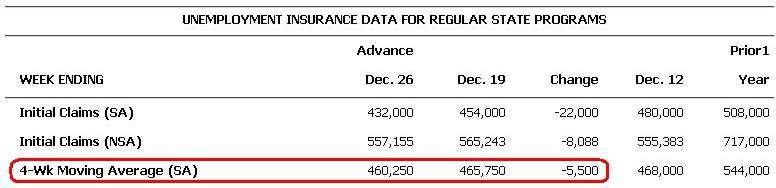
 The Big Picture provided a graphic correlating the historical initial unemployment claims numbers with jobs growth. This expands on my statement last week talking about the magic number for jobs growth is initial unemployment claims being under 450,000.
Additional Economic Data this Week

Bankruptcies this week: None
None
Economic Forecasts Published this Past Week

The Economic Cycle Research Institute (ECRI) released their Weekly Leading Index which edged higher in the latest week, and though its
yearly growth rate slipped. Lakshman Achuthan, Managing Director at ECRI added:
yearly growth rate slipped. Lakshman Achuthan, Managing Director at ECRI added:
Recent steady growth in the leading index points to continuing improvement in economic activity and the jobs market in coming months
I normally end my articles with a “Hat tip to Steve at MEMETICS & MARKETING™ for editing support”. Unfortunately Steve did not edit this article as he died on New Years Eve. I received a call a few hours into the New Year with this news. I dedicate this article to you Steve - the world is diminished by your absence.
Disclosure: long MMF's, GLD, SPY, XPH, XLB, XLV, FTR, IOO, HYG, KSWS, PIN, RIMM, XHB, WMT, GDX, Physical Gold - as well as numerous puts and calls which comprise less than 3% of my portfolio
No comments:
Post a Comment